Aviation Weather Display
An embedded weather terminal that reads live METAR reports and shows the flight category for a set of airports at a glance.
What it is
A desk terminal that shows current conditions at a handful of airports and makes the flight category readable from across the room. It pulls METAR reports from the aviationweather.gov API, decodes them, and draws each field with its category, wind, visibility, and cloud layers.
A raw METAR looks like KGSO 091554Z 18008KT 10SM FEW045 28/19 A3002. That is
perfectly readable once you have learned the format, but it is not something you
absorb in a second while you are doing four other things before a flight. This
build turns that string into something you can glance at.
Why I am building it
I am a student pilot, so I check METARs before I fly. I wanted that information on a physical object on my desk instead of behind an app on my phone. I also wanted a project that would force me to learn embedded C++ properly rather than by pasting a tutorial together.
How it works
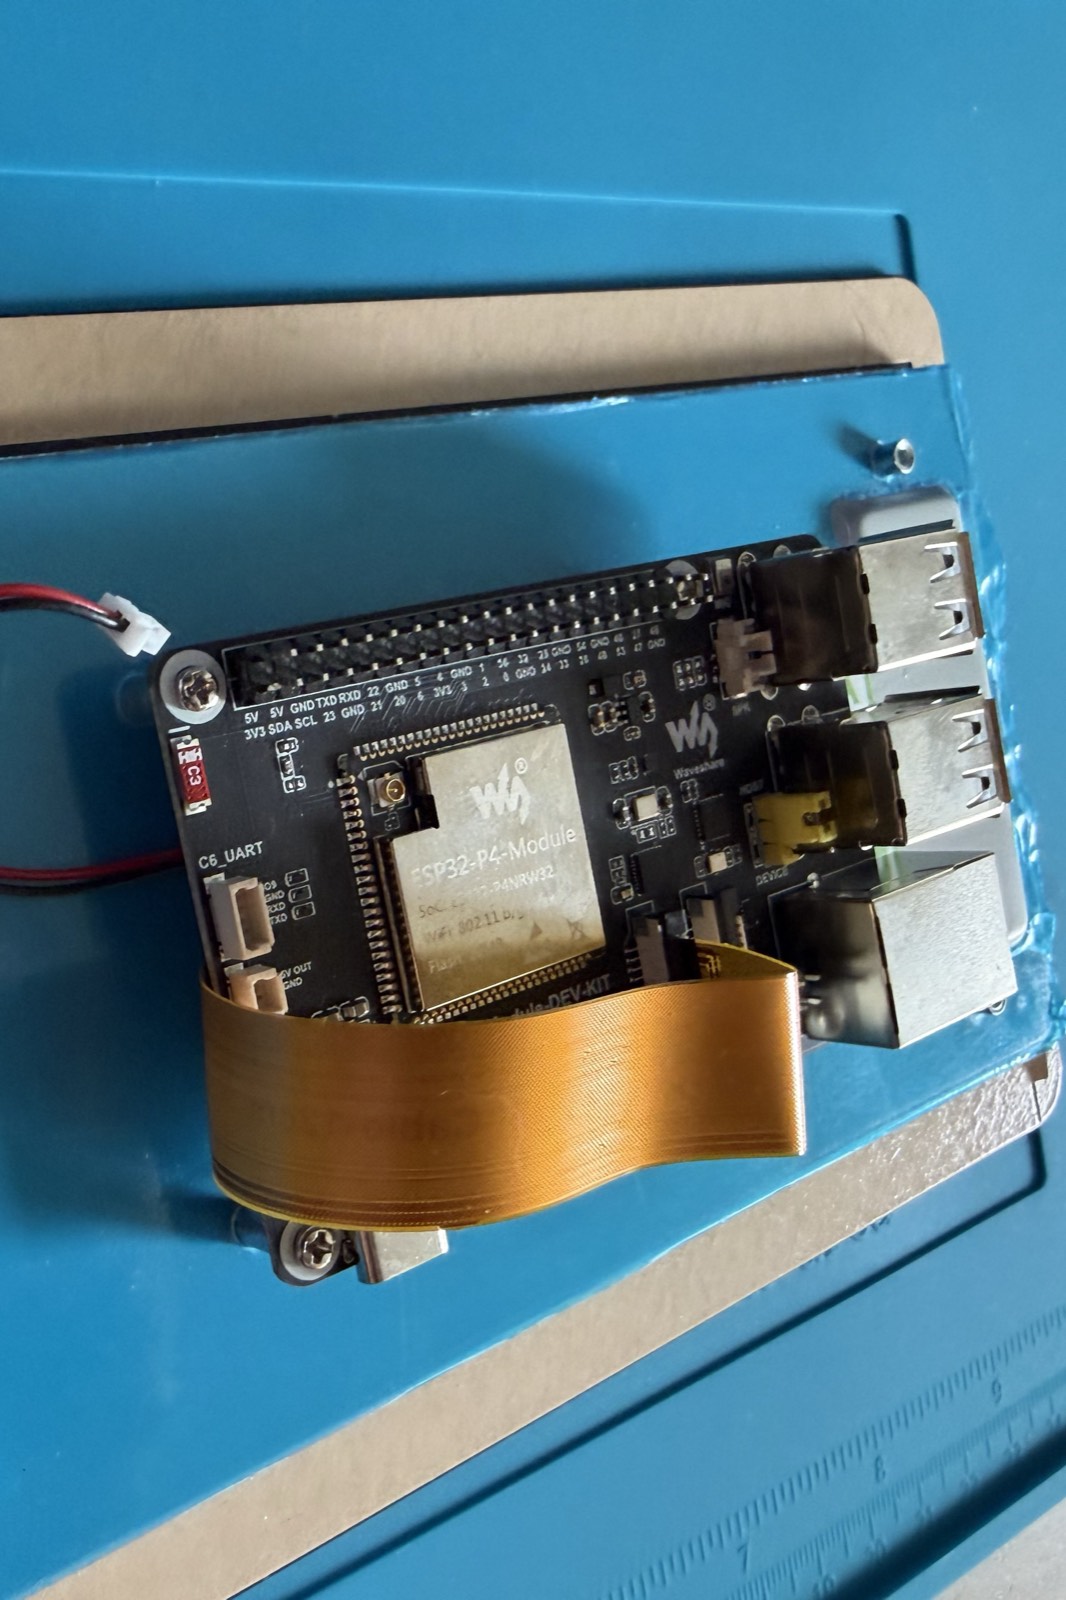
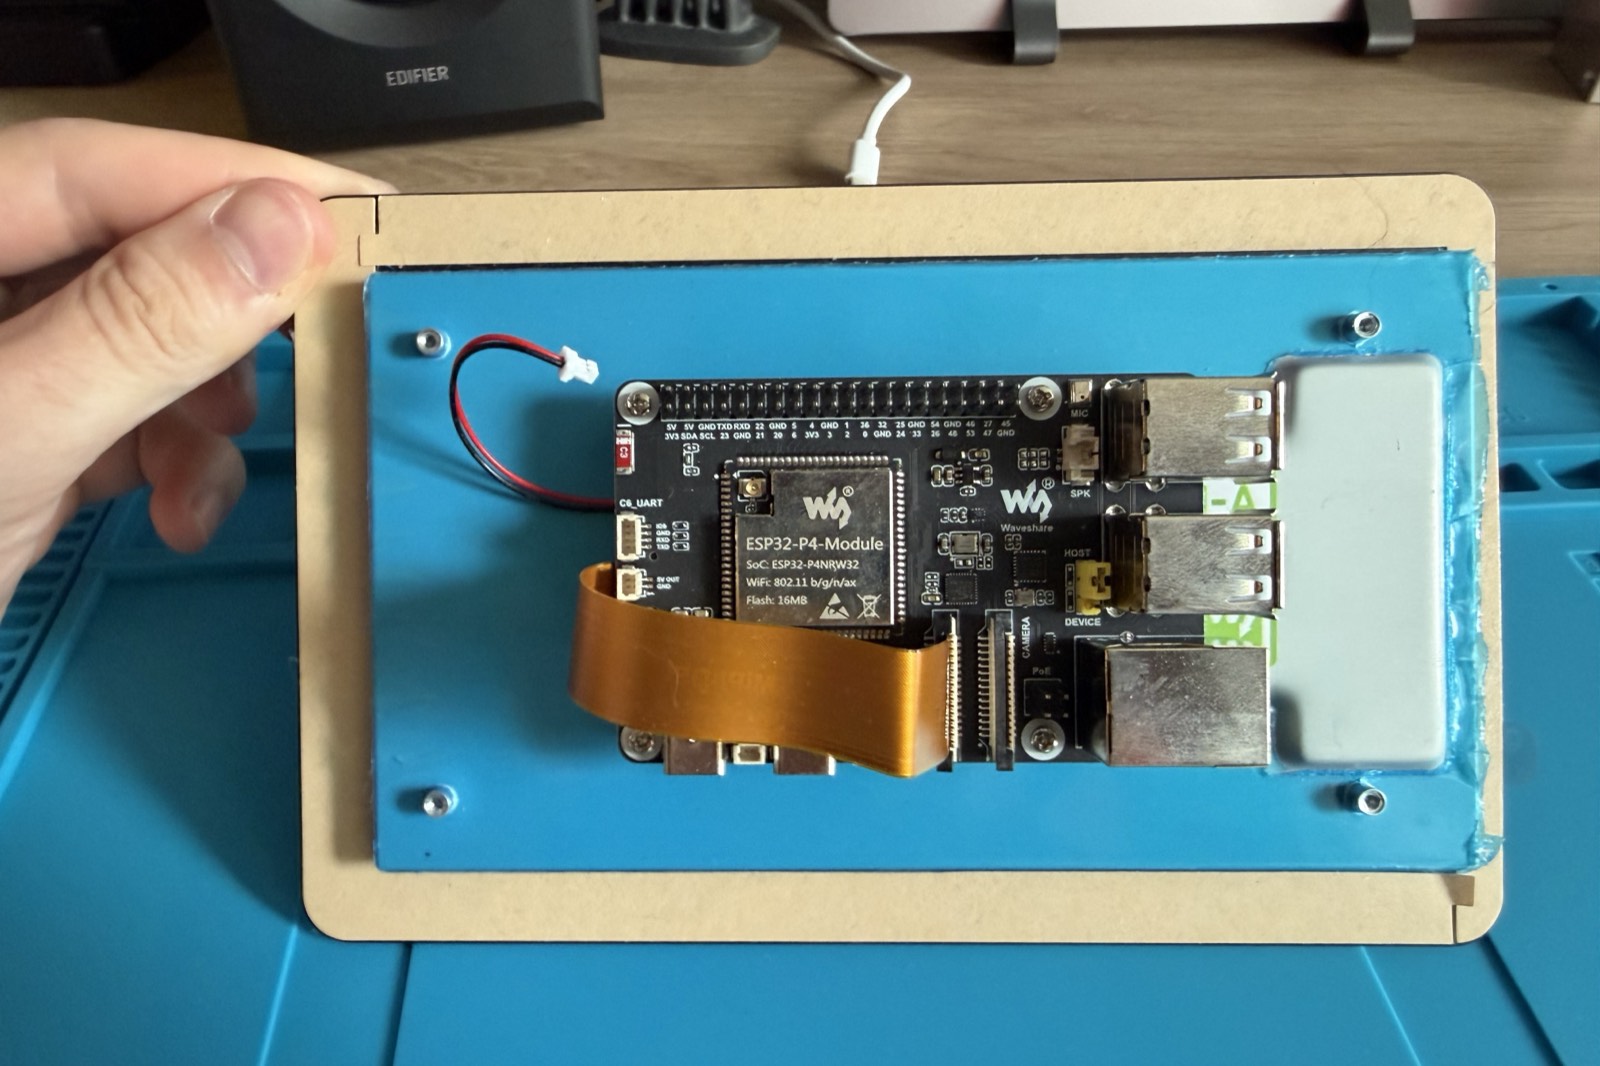
The hardware is a Waveshare ESP32-P4-Module-DEV-KIT-B driving a seven inch Waveshare DSI touchscreen. The panel is 720 by 1280 and portrait native, so the layout is designed tall rather than rotated to fit.
The firmware is C++ on ESP-IDF v5.5.4, built with idf.py and CMake. The
interface uses LVGL through esp_lvgl_port on the device.
Choosing LVGL over raylib
I had already written a Pong clone in raylib, so raylib was the library I actually understood. I picked LVGL anyway.
raylib is immediate mode, which means it redraws the entire frame every tick. That is the right model for a game where most of the screen changes sixty times a second. It is wasted work for a display whose content changes roughly once a minute. LVGL is retained mode. It keeps a widget tree in memory and repaints only the rectangles that actually changed, which fits a mostly static panel far better and leaves the processor idle most of the time.
The data model
The piece I am building now is the Metar type, split across Metar.h and
Metar.cpp. It is the bridge between the network layer and the display layer,
so it has to hold everything a decoded report contains in a shape the interface
can render without parsing anything a second time.
Cloud coverage is stored as a vector of CloudLayer structs rather than as one
flat field. A real report often lists several layers at once, a few scattered
clouds at 4,500 feet with an overcast deck above them. Collapsing that into a
single value would throw away the information that decides the flight category
in the first place.
What I learned
Before this project I had not used pointers, classes, or object oriented programming at all. ECE 220 was C and LC-3 assembly, so I arrived understanding how memory works but with no model for what a header file is for or why a struct would carry methods of its own. I have been working through learncpp.com alongside the build.
The rule I set for myself is that I do not add a line I cannot explain. It is slower than pasting something that compiles, and it is the reason I can tell you why cloud coverage is a vector instead of a field.
Status and what is next
The repository builds cleanly and the data model is the active work. What is still ahead, in rough order.
- An HTTP client to fetch reports from the API
- cJSON parsing into the
Metartype - The flight category logic that decides VFR, MVFR, IFR, or LIFR
- The LVGL widget tree that draws the display
- Integration onto the P4 hardware